All published articles of this journal are available on ScienceDirect.

Effect of Airflow Rate on Vibration Response Imaging in Normal Lungs
Abstract
Background: Evaluating the effect of airflow rate on amplitude of lung sound energy and regional distributionof lung sounds may assist in the interpretation of computerized acoustic measurements.
Objectives: The aim of this study was to assess the effect of airflow rate on Vibration Response Imaging (VRI) measurement in healthy lungs.
Methods: Lung sounds were recorded from 20 healthy adults in the frequency range of 150-250 Hz using 40 piezoelectric sensors positioned on the posterior chest wall. During the recordings, subjects were breathing at airflow rates ranging between 0.3 and 1.7L/s. Online visual feedback was provided using a pneumotach mouthpiece
Results: Amplitude of lung sound energy significantly increased with increasing airflow rate (p<0.00001, Friedman test). A strong relationship (R2=0.95) was obtained between amplitude of lung sound energy at peak inspiration and airflow rate raised to the third power. This correlation did not significantly affect normalized lung sound distribution maps at peak inspiration, especially when airflow was higher than 1.0L/s. Acoustic maps obtained at airflow rates below 0.7L/s differed from those recorded above 1.0L/s (p<0.05, Wilcoxon matched-paired signed-ranks test).
Conclusion: These findings may be of importance when comparing healthy and diseased lungs or when monitoring changes in lung sounds during treatment follow-up.
INTRODUCTION
Mapping of lung sound distribution in the human thorax is a growing field of interest. Dosani and Kraman described a display technique by which contour maps of lung sound intensity were constructed in healthy subjects [1]. Later, Kompis and colleagues depicted a novel method for acoustic imaging of the human respiratory system using a series of multi-sensors simultaneously recording thoracic sounds from the chest wall. A spatial representation of the recorded sounds revealed structural and functional properties of the respiratory system [2]. Acoustic thoracic imaging was further explored by Charleston-Villalobos et al. when comparing different interpolation techniques while positioning a 5x5 microphone array on the anterior and the posterior thoracic surfaces and recording lung sounds [3]. The same investigators also examined acoustic maps resulting from glottal sound transmission through the bronchial-lung-thoracic system [4].
Recently, Dellinger and colleagues described the dynamic visualization of lung sounds with a vibration response imaging (VRI) monitoring system [5]. While breathing flow, volume and timing were not documented, standardization of breathing intensity was obtained from feedback provided by the breathing intensity bar of the instrument. Furthermore, the same authors reported the effect of tidal volume/airflow on sound energy in four healthy volunteers while increasing volume in the range of 0.3 to 1.5L at constant respiratory rate. A linear relationship was described with coefficient of determination R2 values ranging from 0.74 to 0.82 [6]. In this same article, analytical methods were introduced to assess changes in amplitude of lung sound energy (or vibration intensity) and in normalized lung acoustic maps (or images) when changing mode of mechanical ventilation in intensive care patients. A similar approach was recently used to assess changes in regional distribution of lung sounds as a function of positive end-expiratory pressure (PEEP) [7]. Vena and colleagues also reported the acoustic effects of PEEP on normal lung sounds [8].
The aim of the present study was to evaluate the effect of airflow rate on lung sound measurement as obtained with VRI in normal lungs. Repeatability of the measurement was also evaluated.
MATERIALS AND METHODOLOGY
Study Design
Healthy adults without a history of chronic pulmonary disease and with healthy breath sounds (i.e. no adventitious lung sounds), were enrolled in this study after providing informed consent. Deep Breeze Ltd. has received approval from the ethical committee to conduct studies in healthy volunteers. Lung sounds from each subject were recorded five times with an approximately 3-minute rest between recordings. Subjects were instructed to maintain a constant respiratory rate of 20 breaths per minute while average inspiratory flow was adjusted from 0.3 to 1.7L/s (tidal volume between 0.5 and 2.5L) using a pneumotach mouthpiece. Each recording lasted 20 seconds.
Recording Procedure
A schema of the apparatus is provided in Fig. (1). The acoustic measurements were performed using a computer-based lung sound monitoring device (VRI™ System, Deep Breeze™, Or-Akiva, Israel) [9]. Subjects were seated in a quiet environment during the recordings. Lung sounds were measured using two arrays of 7 rows x 3 columns of piezoelectric contact sensors or microphones similar to those used in digital stethoscopes (Meditron ASA, Oslo, Norway). Positioning of the arrays was dictated by anatomical landmarks such as spine and scapula. A low vacuum computer-controlled method was used to attach the arrays uniformly on the posterior chest wall of the exposed back.
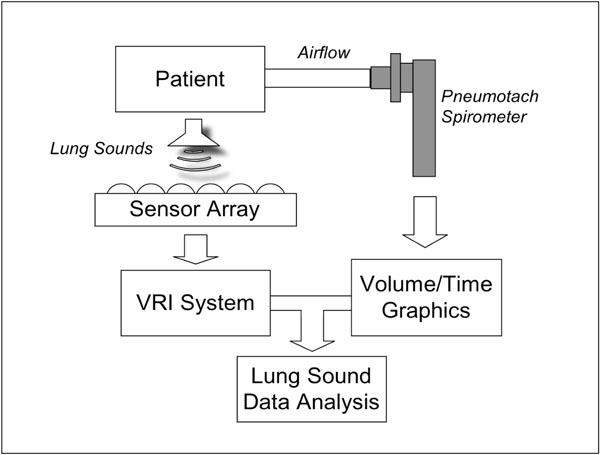
Schematic diagram describing the elements of the system: patient breathing through a pneumotach mouthpiece connected to an external computer with graphic display. Lung sounds are recorded by a sensor array connected to the VRI system and acoustic data are combined with spirometer measurements for analysis.
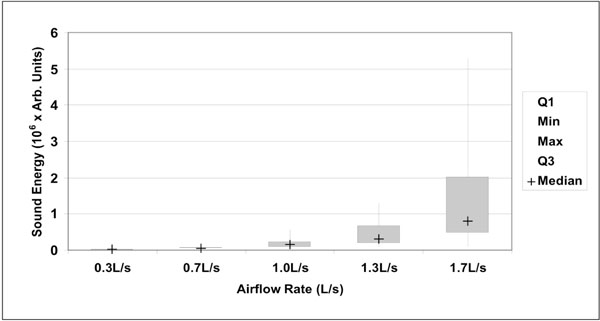
Box plot representation of sound energy as a function of airflow rate (n=20). Boxes indicate 25% and 75% percentiles, with the median sign inside. Error bars represent minimum and maximum values. Differences between each groups was highly significant (p<0.00001, Wilcoxon’s signed-ranks test).
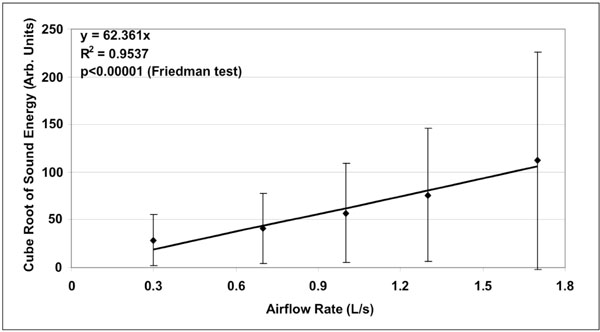
Mean ± standard deviation of the cube root of sound energy as a function of airflow rate (n=20). Linear fit is represented on chart together with corresponding equation. The coefficient of determination R2 was equal to 0.95.
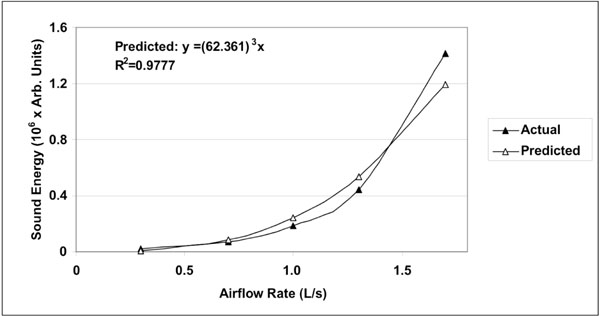
Actual mean sound energy compared to predicted values obtained from the linear regression raised to the third power. The coefficient of determination R2 was equal to 0.98. The normalized root mean square error (NRMSE) between actual and predicted values was 8%.
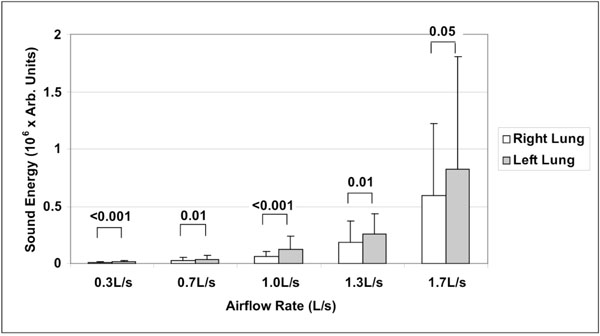
Mean ± standard deviation of sound energy in right and left lungs as a function of airflow rate (n=20). Significant p-values are indicated (Wilcoxon matched-pairs signed-ranks test).
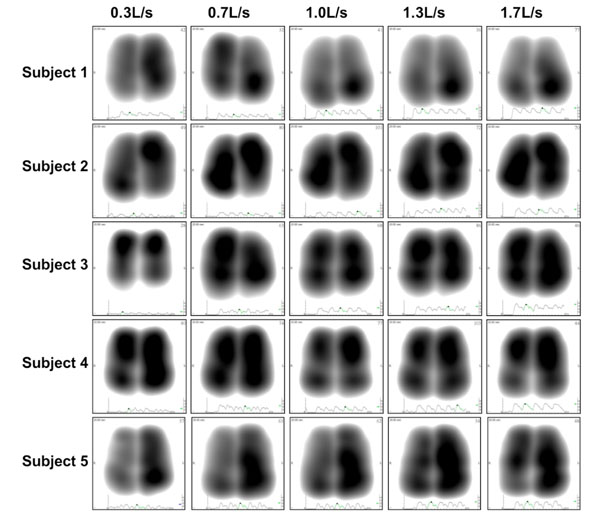
Representative normalized acoustic maps at peak inspiration obtained from 5 individuals recorded at five levels of airflow rates varying from 0.3 to 1.7L/s.
Subjects were asked to breathe through a pneumotach mouthpiece connected to a KoKo Pneumotach Spirometer (Pulmonary Data Services, Louisville, CO) with customizable software. A real-time display of the delivered volume as a function of time was presented on a computer screen. After attachment of the piezoelectric contact sensors and initiation of the recording procedure, subjects were instructed to hold their breath for three seconds and then to breathe into the pneumotach mouthpiece. This was performed in order to synchronize the 20-second lung sound recording with the 15-second pneumotach signal. During the recordings, the subjects were provided real-time graphic feedback.
Measurement Output
Acoustic signals were stored digitally on the system for later review and analysis. A 64 multi-channel analog to digital converter was used to filter and amplify the sensor signals, acquired at a 16-bit acquisition level and a sampling rate of 19.2 kHz. A band-pass filter between 150 and 250 Hz was applied to remove heart and muscle sounds; median filtering was performed to suppress impulse noise, and truncation of samples above an automatically determined signal-to-noise threshold was carried out. Lung sound energy was obtained following down-sampling and a total of 118 data points were collected during the 20 second recording. Each point represented 0.17 seconds of sound energy expressed in arbitrary units (AU). Sound energy was synchronized with the respiratory volumes obtained from the pneumotach spirometer hardware. The onset of inspiration, for both the sound energy and volume graphs, was detected automatically and then confirmed by visual inspection. Onset of the first complete respiratory cycle after breath hold was used to synchronize both waveforms. The analysis was performed on a representative data point corresponding to peak-inspiratory flow.
Data analysis was performed on amplitude of lung sound energy as well as on regional distribution of lung sounds. The absolute amplitude of sound energy, which was not affected by normalization, was obtained for each sensor and the sum of sound energy in the right and left lungs, as well as the total sound energy in both lungs, were computed off line at peak inspiration. Normalization was applied to a set of three data points around peak-inspiration. A normalized regional lung sound distribution map was generated within this range. Areas with the highest sound energy were represented as black in a gray-level scale and areas with the lowest sound energy as light gray or white. Resulting normalized acoustic maps were quantified and presented as the percentage of weighted pixels in three lung areas: upper or apical (two upper rows of sensors), middle (three middle rows of sensors) and lower or diaphragmatic (two lower rows of sensors), summing to a total of 100%.
Statistical Analysis
Data are presented using descriptive statistics as mean ± standard deviation (SD). Wilcoxon’s signed-ranks test was used for paired data, Mann-Whitney U-test for unpaired data, one-way ANOVA to analyze variance between groups and Friedman test for two-way repeated measures analysis of variance by ranks. Analyses were performed using statistics software (IFA Services Statistics, Amsterdam, Holland). Coefficients of determination R2 and normalized root mean square error (NRMSE) were obtained using Microsoft® Office Excel 2003 (Microsoft Corporation, Redmond, WA). A p-value lower than 0.05 was considered significant.
RESULTS
A total of hundred (100) lung sound recordings were performed on 20 healthy adults (19 males, 1 female; age 33 ± 6 years). Mean weight was 77 ± 9 kg, mean height 176 ± 5 cm and mean body mass index (BMI) 25 ± 2. Mean amplitude of lung sound energy recorded from all the sensors at peak inspiration increased with airflow rate as summarized in Fig. (2). Differences between recordings at 0.3, 0.7, 1.0, 1.3 and 1.7L/s were highly significant as revealed by Friedman test (p<0.00001). The result of a regression analysis conducted on the cube root of mean sound energy is displayed in Fig. (3). As shown in this figure, the data was linear with a coefficient of determination R2 equal to 0.95. Furthermore, as shown in Fig. (4), a strong correlation between the actual sound energy and the predicted values obtained from the linear regression raised to the third power was obtained (R2=0.98). The normalized root mean square error (NRMSE) between actual and predicted values was relatively small (8%). This finding confirms a strong correlation between sound energy and the third power of airflow rate in healthy lungs during inspiration. Furthermore, mean sound energy from the left lung was 25-50% higher than from the right lung (Wilcoxon matched-pairs signed-ranks, p<0.05) as illustrated in Fig. (5). Mean sound energy was also analyzed according to age, height, weight and BMI. Median for each parameter was used as cut-off. In average, sound energy was increased in younger and shorter subjects but this increase was not statistically significant in our data set (Mann-Whitney U-test). Normalized lung sound energy maps at peak inspiration were obtained for each subject at each level of airflow. Examples of these maps are provided in Fig. (6). As shown in this figure, only minimal visual changes were detectable in normalized maps recorded between 0.3 and 1.7L/s. Regional distributions of average weighted pixels from each map were compared across airflow rates. As revealed in Table 1, the proportion of sound energy in the right and left lungs was not altered by changes in airflow rate. Moreover, no significant differences in regional distribution were encountered between maps obtained at 1.0, 1.3 and 1.7L/s.
Mean ± Standard Deviation of the Percentage of Weighted Pixel Counts in Left and Right Lungs as Well as in Upper (Apical), Middle and Lower (Diaphragmatic) Lung Segments at Airflow Rates Ranging Between 0.3 and 1.7L/s. Significant Differences Encountered Between Lower and Higher Flow Ranges are Reported (Wilcoxon Matched-Pairs Signed-Ranks Tests, p<0.05). NS Means No Significant Differences
| Lower Flow Range | Higher Flow Range | Lower vs Higher Flow | ||||
|---|---|---|---|---|---|---|
| 0.3L/s | 0.7L/s | 1.0L/s | 1.3L/s | 1.7L/s | p Value | |
| Total Left | 58 7% | 55 7% | 57 7% | 57 8% | 54 7% | NS |
| Total Right | 42 7% | 45 7% | 43 7% | 43 7% | 46 7% | NS |
| Upper | 30 6% | 29 7% | 26 9% | 24 8% | 25 6% | <0.05 |
| Middle | 33 3% | 34 4% | 32 4% | 33 5% | 32 4% | NS |
| Lower | 37 8% | 37 9% | 42 11% | 44 11% | 42 8% | <0.05 |
However, significant differences were encountered in the apical and diaphragmatic lung areas between lung sound distribution maps recorded at airflow rate below and above 1.0L/s (Wilcoxon Matched-Pairs Signed-Ranks).
Finally, the repeatability of the measurement was assessed in three repeated respiratory cycles for each patient at each flow rate. Repeatability was performed by comparing the distribution of sound energy in each of the six lung regions, as well as in total left and right lungs. No significant difference was encountered between repeated measurements (one-way ANOVA for repeated measures).
DISCUSSION
Although there is a general consensus that an increase of respiratory flow rate induces louder breath sounds [10, 11], the exact nature of the relationship between airflow and lung acoustic in normal subjects has not been firmly established [12]. A linear relationship has been reported by Leblanc [13], Kraman [14] and Hossain [15], a quadratic relationship has been described by Shykoff [16] and a third power by Olson [17, 18]. Other relationships have been proposed [19-23] and Nakano and colleagues investigated the most suitable frequency band to analyze regional ventilation. Correlation was best at frequency bands from 150 Hz to 850 Hz with correlation coefficients exceeding 0.8 [24]. The disparity of the results reveals high variability due to method of measurement and data analysis. In healthy lung, the total cross sectional area of the airways increases rapidly along the bronchial tree. This causes the gas flowing in the airways to decelerate while maintaining flow. This deceleration is enabled through the turbulence occurring in the multiple tree bifurcations as well as the continuous friction with the inner surface of the airways. It is within reason to assume that in healthy lung, the gradual dissipation of the flow’s kinetic energy along the bronchial tree is a prime source of lung sounds that are associated with flow. In this context, total initial kinetic energy of the flow (when entering the trachea) is expected to correlate with total sound energy. However, this description only holds when the decay of sound within the parenchyma can be averaged out between all possible pathways, and when sound energy is integrated over the time required to travel along the tree. Under theses terms, the kinetic energy associated with flow can be approximated via a third order function of flow rate as experimentally observed in our study. This finding is also compatible with classical principles related to the power content of free unobstructed air moving at a constant speed in a cylindrical column [25].
Despite the strong relationship between amplitude of lung sound energy, as measured with the VRI, and airflow rate raised to the third power, the relative regional acoustic distribution, as accounted by the normalized acoustic map and related pixel count assessment, was not affected by airflow in the 1.0-1.7L/s range. However, an increase in regional distribution of lung sounds was observed in the more peripheral lung areas when increasing flow from 0.3-0.7L/s to 1.0-1.7L/s. These findings are compatible with earlier studies describing the regional distribution of inspired gas and the effect of inspiratory flow rate on this distribution [26-28]. Milic-Emili et al. studied the expansion of different regions of the lungs at various lung volumes in seated normal men using radioactive gas. At low inspired volumes, changes were greater in the upper than in the lower lung regions, whereas the opposite was true at higher lung volumes. Ploy-Song-Sang et al. confirmed these results in a study reporting the distribution of regional ventilation measured by breath sounds in normal subjects. The authors established that ventilation to lower portions of the lung increased as lung volume increased [11]. As confirmed by our study, a certain rate is necessary in order for the flow to reach more peripheral lung areas and for lung sounds to be detectable in these areas. Once airflow is distributed in these more distal segments, changes in normalized lung sound distribution maps are less significant. In fact, the effect of normalization on the acoustic map appears to reduce the effect of changes in flow rate that are not producing changes in airflow regional distribution. This finding supports previous observation that the increase of lung sound distribution in diaphragmatic lung areas when changing mode of mechanical ventilation from volume control to pressure support is due to increase in airflow re-distribution to the diaphragmatic lung segments rather than to changes in ventilator settings [6]. Additional data points in the 0.7-1.0L/s airflow range may have been useful in order to further investigate this aspect.
Another interesting finding of our study was that, at each level of flow rate, lung sounds recorded in the left lung were significantly higher than in the right lung. This intrinsic right/left acoustic asymmetry has been previously reported during tidal breathing [29] and was explained by the effect of mediastinal structures and airway geometry on airflow turbulence [1, 30, 31], particularly due to the curvature of the left bronchus. Our study further validates these findings at different levels of flow rate. Moreover, the lack of significant difference related to variables such as age, height, weight and BMI may be explained by the relatively high homogeneity of the enrolled population. Finally, the repeatability of the VRI measurement obtained in our study was comparable with previous reports in healthy individuals [29] as well as mechanically ventilated patients [7].
One of the limitations of our study is the elevated standard deviations detected in all the analyses related to amplitude of sound energy. This variability, also observed in earlier studies [6], may be explained by the algorithm used to calculate lung sound energy as the sum of squared amplitudes in a 0.17 second window. Variability of measurements could also be related to lung parenchymal sound absorption which may differ for each individual. Another limitation includes the lack of enrollment of female patients compared to male patients due to the measurement procedure requiring exposing the bare back. Since gender-related differences in lung sounds have been reported [32], it could have been interesting to further study the impact of gender in the airflow-sound relationship. Finally, sound filtering to a band-pass of 150-250Hz may have reduced the information as lung sound characteristics are contained in other frequency bands, especially above 250Hz.
Despite these limitations, the results obtained in this study are of particular interest since they can be used in future development of dedicated algorithms based on difference between predicted regional lung sound energies (calculated based on applied flow) and recorded energy values in diseased lungs. This could aid in the diagnosis of sound-increasing pathologies (such as consolidations) or sound-decreasing pathologies (such as atelectasis). Furthermore, the ability to differentiate between the functionality of two lungs separately could be useful in pre-transplant state [33]. Comparison between normal and diseased lungs [34-37] should be further investigated in the perspective of these findings, particularly in patients with chronic obstructive pulmonary disease or asthma [38-40].
CONCLUSION
As demonstrated in this study, the effect of flow rate on normalized acoustic maps appeared to be minimal when not connected with changes in regional distribution of airflow. However, a certain level of flow rate may be necessary in order to standardize normalized acoustic maps obtained with VRI. Furthermore, the correlation between amplitude of lung sound energy and airflow raised to the third power may be of particular clinical value when predicting the expected (normal) sound energy measured from each lung region and comparing it to the actual measurement. This may be of importance when evaluating asymmetric sound distribution or when assessing treatment efficiency. This should be further investigated in diseased lungs as well as on mechanically ventilated patients.
CONFLICT OF INTEREST
MY and RL were employees of Deep Breeze, Ltd. at the time of the study. SL has a consultant agreement that includes honoraria and stock options (no current monetary value) with Deep Breeze Ltd and he was sponsored by GE Healthcare, Deep Breeze’s distributor worldwide, to give lectures in academic meetings. YAG is an employee of Deep Breeze Ltd. and has stock options (no current monetary value).