All published articles of this journal are available on ScienceDirect.

Using Spirometry to Rule Out Restriction in Patients with Concomitant Low Forced Vital Capacity and Obstructive Pattern
Authors Info & Affiliations
Abstract
Background:
Different formulas have been proposed to exclude restriction based on spirometry, however none of them have specifically tested the patients whose spirometry show both obstruction and a low forced vital capacity (FVC).
Study Objective:
The study was designed to create an algorithm that would better predict the absence of restriction in such patients.
Design:
Retrospective analysis of prospectively collected data.
Methods:
A cohort of consecutive adults that underwent complete pulmonary function testing from 2002-2004 was analyzed. The data was randomly split into two groups to allow for derivation and then validation of a predictive formula. Patients were randomly assigned into either a “derivation” or “validation” group. In the derivation group, stepwise logistic regression was used to determine a formula and optimal cut-off value for the variable with the best discriminative capacity. The formula was applied subsequently to the validation group to test the results and compared to previously published formula.
Results:
The study group contained 766 patients. We determined that the variable with the highest association with TLC was [(FEV1/FVC) % predicted/FVC % predicted]. A value of ≥1.11 was found to be the maximal cutoff to predict the absence of restriction.
The formula was applied to a validation group (n=397) and performed better than prior published algorithm with a sensitivity, specificity, positive predictive value and negative predictive value of 95%, 44%, 22%, and 98%, respectively.
Conclusion:
Our formula performs superior to the previously published algorithms in patients with concomitant low FVC and obstruction to exclude restriction.
INTRODUCTION
Spirometry is a simple diagnostic tool based on the measurement of respiratory airflow. Its main use remains in screening and diagnosis of airflow obstruction which is characterized by a low ratio of forced expiratory volume exhaled in one second (FEV1) to the forced vital capacity (FVC) [1]. However, it can also help to exclude restriction when the FVC is normal [2-4].
A common scenario that arises in routine spirometry is when both the ratio of FEV1/FVC and FVC are below the lower limits of normal. This can represent what has been described as “mixed abnormality”, which is characterized by the coexistence of obstruction and restriction in a person [5]. In the presence of airways obstruction, it is a well known fact that the FVC can be low due to air trapping [6]. This air trapping is the cause of the “mixed abnormality” in 87% of such cases and only approximately 10% of the cases have true restriction [3,7]. This observation is supported by the fact that even in patients who have a typical restrictive pattern (normal or high normal FEV1/FVC ratio and low FVC), spirometry only has a sensitivity of approximately 68% and positive predictive value of about 58% in diagnosing true restriction when compared to total lung capacity (TLC) [2,3]. ATS/ERS guidelines state that when FVC is low, presence of a restrictive component in an obstructed patient cannot be inferred from simple measurement of FEV1 and FVC [4]. In those patients, measurement of TLC is necessary to exclude restriction [2,4]. Diagnosis of restriction is made by a reduction of TLC below the 95 percent confidence interval of normal of the predicted value for an individual [4].
Lung volumes can be measured by helium-dilution method, nitrogen wash out method or plethysmography/body box method [5]. These are usually available in licensed pulmonary function labs and primarily ordered to diagnose restrictive pulmonary impairment [6]. Average cost of measuring lung volumes in United States is about $288 [3]. The performance of lung volumes in all patients with obstruction and a low FVC obviously consumes resources and time. Thus, it would be useful to be able to limit lung volume testing by excluding patients at low risk for concomitant restriction.
Glady et al. previously developed an algorithm that suggested the need for TLC measurement if the forced vital capacity (FVC) was <85% of predicted and the ratio of FEV1/FVC was >55% [2]. Their algorithm had a high sensitivity to predict restriction and a high negative predictive value to exclude restriction. However, their study population included all comers for spirometry and did not specifically test the patient population with a low FVC in the presence of a reduced FEV1/FVC ratio. Another algorithm was proposed by Swanney et al., but they also did not specifically test this subgroup of patients [8].
The goal of our study was to formulate a tool to exclude restriction specifically in patients who show both obstruction and a low FVC on spirometry (for whom TLC measurement is recommended by ATS/ERS 2005 guidelines) and compare the validity of the tool with the one proposed by Glady et al.
METHODS
Study Population
This study was reviewed and approved by the hospital’s Institutional Review Board. We queried our database for all patients who underwent complete pulmonary function test evaluation at the Pulmonary Laboratory at a tertiary care teaching hospital between January 1, 2002 and December 31, 2004. A complete pulmonary function test evaluation included spirometry and a total lung volume measurement performed on the same day, as ordered by the referring physician. Studies were collected for further analysis if they showed obstruction and a low FVC. Obstruction was defined by a FEV1/FVC ratio less than the lower limit of normal (LLN) of the predicted value for this ratio using the third National Health and Nutrition Examination Survey (NHANES III) criteria [9]. The LLN was defined as the lower 95% confidence limit of normal i.e., 1.645 times the standard deviation below the mean predicted reference value [9]. A low FVC was defined as a FVC that met one of two criteria; either less than the lower 95% confidence limit of normal (1.645 x SD below the mean) or <75% of predicted (to account for shorter, aged individuals whose lower confidence limit would be artificially markedly reduced). The TLC lower limits of normal were defined as with the FVC. The lower 95% confidence limit from the mean was used (adjusting for racial differences based on ATS/ERS guidelines 2005 guidelines), again using an absolute lower limit of normal of 75% of predicted to account for the excessively large errors caused in aged elderly patients [10]. We excluded patients younger than 18 years old, and those who did not complete the tests. We only included the first study if the same patient had two or more tests during the study period. For those studies where a bronchodilator was used, we only considered the pre-bronchodilator variables for analysis purposes.
Methodology
Pulmonary function tests were performed according to the ATS/ERS publications for spirometry, plethysmography, and nitrogen washout [11-13]. The data was obtained using Viasys Legacy and Spectra pulmonary function systems. Lung function testing equipment was calibrated daily using a 3 liter syringe. TLC was measured by both body plethysmography and nitrogen washout, taking the higher of the 2 values using the Residual Volume (RV) + Vital Capacity (VC) method. The pressure transducer for plethysmography was calibrated daily with a 50 ml pump operating at approximately 2 Hz to ascertain the accuracy of the pressure deflections, and nitrogen washout was calibrated using two gas concentrations of 100% oxygen and a mixture of 16% O2, 4% CO2 and 80% N2. Biologic controls were also performed monthly.
Variables
We collected the following data for analysis: sex, age, race, forced expiratory volume in the first second (FEV1), forced expiratory volume in the first six seconds (FEV6), forced expiratory flow between 25-75% (FEF 25-75), FVC, Slow Vital Capacity (SVC), and TLC. We also recorded the predicted values for all these variables and when pertinent, the observed value divided by the predicted value which was then multiplied by 100 to obtain the percent predicted (% pred).
Study Groups
All the studies which satisfied our criteria were randomly divided into two groups of approximately equal size. One group was used to derive a formula to predict the absence of restriction. This group was labeled as “derivation group”. The remaining patients were then used to test the predictive formula and were labeled “validation group”.
Statistical Analysis
We studied only those patients with concomitant obstruction and a low FVC. These patients were divided into two groups depending whether or not restriction was present, as evidenced by a low TLC. The student-t test was used to compare all continuous variables for differences between patients with and without restriction. The chi-square test was used to compare nominal variables.
Using only the derivation group, a stepwise logistic regression analysis was used to find those factors that were independently associated with restriction. The variables that were investigated included all the ones mentioned above as well as combined variables felt to be potentially revealing by the authors. The four combined variables that were investigated included: (FEV1/FVC)/FVC % pred, (FEV1/FVC) % pred/FVC % pred, (FEV1/FEV6)/FVC % pred, and (FEV1/ FEV6) % pred/FVC % pred. Sample calculation based on an actual spirometric analysis is shown in Table 1.
Calculations According to Different Investigated Formulas on a Sample Spirometry
| Spirometry | Variables | Measured Value | Reference Value | % (Percent) Reference |
|---|---|---|---|---|
| FVC | Liters | 2.83 | 4.07 | 70 |
| FEV1 | Liters | 1.68 | 3.05 | 55 |
| FEV1/FVC | % | 59.3 | 75.7 | 78 |
| FEV3 | Liters | 2.24 | 3.64 | 61 |
| FEV3/FVC | % | 79 | 88.4 | 89 |
| FEV6 | Liters | 2.55 | 3.88 | 66 |
| FEV1/FEV6 | % | 66 | 79.2 | 83 |
| FEF25-75% | Liters/Second | 0.55 | 2.51 | 22 |
| PEF | Liters/Second | 4.38 | 8.36 | 52 |
| FET100% | Second | 4.38 | 8.36 | 52 |
| Calculation of Investigated Variables: | ||
|---|---|---|
| (FEV1/FVC)/FVC %predicted | = 0.57/0.72 = 0.79 | = 0.59/0.70= 0.84 |
| (FEV1/FVC) %predicted/FVC %predcited | = 0.76/0.72 = 1.06 | = 0.78/0.70= 1.11 |
| (FEV1/FEV6)/FVC %predicted | = 0.66/0.72 = 0.92 | = 0.66/0.70= 0.94 |
| (FEV1/FEV6) % predcited/FVC %predcited | = 0.83/0.72 = 1.15 | = 0.83/0.70= 1.18 |
Abbreviations: FVC (Forced Vital Capacity); FEV1 (Forced Expiratory Volume in 1 Second); FEV3 (Forced Expiratory Volume in 3 Seconds); FEV6 (Forced Expiratory Volume in 6 Seconds); FEF25-75% (Forced mid-expiratory flow rate); PEF (PeakExpiratory Flow); FET100% (Forced Expiratory Time).
Study Group Compared by the Presence or Absence of Restriction Based on TLC
| Characteristics | Restriction N = 154 |
No Restriction N = 836 |
Significance (P) |
|---|---|---|---|
|
|
|||
| Age† | 59.5 ± 14.9 | 61.3 ± 11.7 | 0.14 |
|
|
|||
| Male sex (%)‡ | 75 (48.7) | 392 (46.9) | 0.68 |
|
|
|||
| Race (%) | |||
| African-American | 70 (45.5) | 262 (31.3) | 0.003 |
| Caucasian | 83 (53.9) | 570 (68.2) | |
| Hispanic | 1 (0.7) | 4 (0.5) | |
|
|
|||
| FEV1 | 1.23 ± 0.41 | 1.26 ±0.49 | 0.45 |
|
|
|||
| VC | 1.89 ± 0.58 | 2.26 ± 0.65 | <0.0001 |
|
|
|||
| FEV6 | 1.77 ± 0.52 | 2.00 ± 0.59 | <0.0001 |
|
|
|||
| FEF 25-75 | 0.74 ± 0.46 | 0.61 ± 0.44 | 0.0007 |
|
|
|||
| TLC | 3.63 ± 0.75 | 5.67 ± 1.39 | <0.0001* |
† All continuous variables are reported as mean ± standard deviation
‡ In all cases, the percentage shown represents the column percentage for that value.
Abbreviations: FEV1: Forced Expiratory Volume in 1 Second; VC: Vital capacity; FEV6: Forced Expiratory Volume in 6 Seconds; FEF 25-75: Forced Mid-Expiratory Flow rate; TLC: Total Lung Capacity.
Two-by-Two Table of our Derivation Group Based on our Formula
| Restriction Present | Restriction Absent | Total | |
|---|---|---|---|
| Formula suggests need to assess TLC | 75 | 230 | 305 |
| Formula suggests no need to assess TLC | 4 | 164 | 168 |
| Total | 79 | 394 | 473 |
TLC recommended if (FEV1/FVC % pred)/FVC % pred <1.11.
Abbreviations: TLC: Total Lung Capacity; FEV1: Forced Expiratory Volume in 1 Second; FVC: Forced Vital capacity.
Two-by-Two Table of the Validation Group Based on our Formula
| Restriction | No Restriction | Total | |
|---|---|---|---|
| Formula suggests need to assess TLC | 71 | 246 | 317 |
| Formula suggests no need to assess TLC | 4 | 196 | 200 |
| Total | 75 | 442 | 517 |
TLC recommended if (FEV1/FVC % pred)/FVC % pred <1.11.
Abbreviations: TLC: Total Lung Capacity; FEV1: Forced Expiratory Volume in 1 Second; FVC: Forced Vital capacity.
Two-by-Two Table of Study Group Based on Glady’s Algorithm
| Restriction | No Restriction | Total | |
|---|---|---|---|
| Formula suggests need to assess TLC | 67 | 248 | 315 |
| Formula suggests no need to assess TLC | 8 | 194 | 202 |
| Total | 75 | 442 | 517 |
TLC recommended if FVC<85% of predicted and FEV1/FVC ≥55%
Abbreviations: TLC: Total Lung Capacity; FEV1: Forced Expiratory Volume in 1 Second; FVC: Forced Vital capacity.
Logistic regression was used to discover the variable with the strongest association to TLC. This was done by doing stepwise logistic regression to find the variable with the best predictive power. Multiple cut points of the predictor variable were then evaluated in a series of two-by-two tables to determine the optimal value to maximize sensitivity while maintaining a reasonable specificity. A final two-by-two table was then created based on our formula to calculate the sensitivity, specificity, positive predictive value (PPV), and negative predicted value (NPV) in the derivation group.
We then used a validation group as an independent cohort to test the validity of our model. We constructed another two-by-two table to calculate the sensitivity, specificity, PPV, and NPV in the validation cohort using the same predictive equation. The utility of this validated model was further assessed by comparing our results to Glady’s published models for predictive equations [2]. We used an alpha level of 0.05 for all the analysis and all the analysis was performed using SAS®, Inc. software (Cary, North Carolina, USA).
RESULTS
A total of 2812 patients had complete pulmonary function tests (spirometry, lung volumes and DLCO) in our laboratory during 2002. >From those, 990 had a low vital capacity and an obstructive pattern on spirometry. A total of 154 (15.6%) patients in this group were found to have restriction. The characteristics of those patients with and without restriction are shown in Table 2.
We then divided our study population into two groups by use of a random number generator. Thus, 473 studies were used to derive a predictive equation and labeled the “derivation group”. Using logistic regression analysis in this group, we found many spirometric variables that were independently associated with restriction. These variables included: FVC, FEF25-75, FEV6, FEV1/FVC, FEV1/FEV6, FVC percent predicted, FEV6 percent predicted, FEF25-75 percent predicted, FEV1/FEV6 percent predicted and FEV1/FVC percent predicted. All of the four combined variables described in the methods were independently associated with the presence of restriction as well. However, the variable that was most strongly correlated and the only one that remained when using stepwise regression was a ratio of two ratios, represented as the ratio of FEV1/FVC percent predicted divided by the FVC percent predicted [(FEV1/FVC) % pred/FVC % pred]. This variable was then further evaluated for its discriminative abilities. We were able to determine the value of 1.11 as the maximal cut point for specificity. Thus, a value of [(FEV1/FVC) % pred/FVC % pred] ≥1.11 would determine absence of restriction. Applying this cut off to our “derivation” group results in the outcome, as shown in Table 3. Using this data, we find that the sensitivity, specificity, PPV, NPV were 95%, 42%, 25%, and 98% respectively.
We then validated our predictive equation in the remaining 517 patients. The discriminative formula was thus applied to this “validation group”. When our formula was applied to this group, we found that our formula significantly predicted the absence of restriction (p< 0.0001), with the results shown in Table 4. In the validation group, the sensitivity, specificity, PPV, NPV were 95%, 44%, 22%, and 98%, respectively. Thus, both in our derivation and validation groups, our formula had a NPV of 98%.
To assess whether our formula had added utility over what has previously been published, we compared our results with those that would be obtained by applying the algorithm published by Glady et al. Using that formula, we were able to construct a two-by-two table in the validation group as shown in Table 5. The sensitivity, specificity, PPV and NPV of the Glady algorithm were found to be 89%, 44%, 21% and 96%, respectively. The sensitivity and NPV, important to exclude restriction, were lower in Glady’s algorithm compared to our formula. However, these differences could be simply due to the selection of a cut-off. Thus, we wanted to assess how the variables used in these formulas performed throughout the range of values in the entire data set. Thus, we constructed Receiver Operating Characteristics (ROC) Curves for our combined ratio [(FEV1/FVC) % pred/FVC % pred] (Fig. 1) and the ratio used by Glady et al. (Fig. 2) The ROC curve using our variable was more accurate with an area under the curve of 0.811 as compared to 0.713 for the variable used by Glady et al.
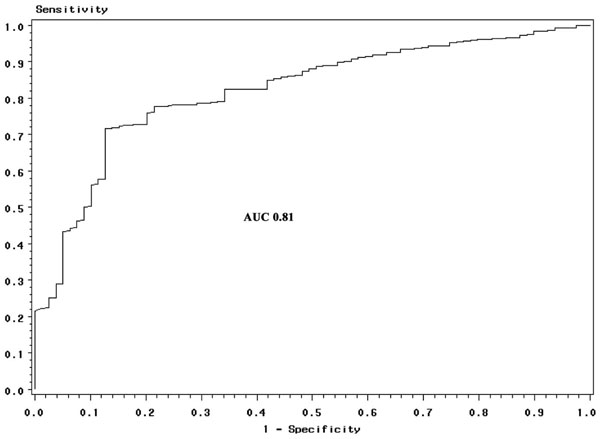
Area under the curve based on our formula (AUC = 0.81).
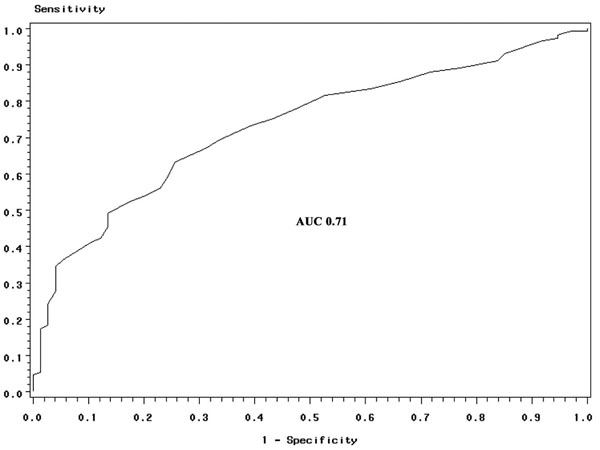
Area under the curve based on Glady et al. formula (AUC = 0.71).
DISCUSSION
This study shows that spirometry can be useful to exclude those patients with a low risk for restriction despite the presence of a low VC when obstruction is present.
The very high negative predictive value of spirometry shown in this study has a cost-saving implication, avoiding the need for further testing in a vast subset of patients. Based on our results 39% (200/517) of unnecessary total lung volume measurement could be avoided and we would still be able to diagnose 95% (71/75) of the patients with restriction.
Swanney et al., in a recent study, compared their algorithm to one proposed by ATS and the one by Glady et al. [8]. However, their study population was different than ours and included all comers for spirometry as did the Glady’s study, and did not specifically look at the study population that we used. Their formula was slightly inferior to Glady’s formula in effectiveness as a screening tool to rule out restriction. We, therefore picked Glady’s formula and applied to our study population to assess its effectiveness in this different cohort of patients.
When we applied Glady’s algorithm to our study population, we found that our formula performed better based both on cutoffs and continuous assessment. Both sensitivity (95% vs 89%) and NPV (98% vs 96%) were found to be higher on our formula. Also, the variable performed better over the range of its values as shown by the area under the ROC curves (0.81 vs 0.71). Using Glady’s algorithm we would avoid about the same number of tests (39%) but would only diagnose 136 of the 154 (89%) patients with restriction. Hence, we can conclude that compared to Glady’s formula, our formula is a better screening test to rule out restriction in patients whose spirometry shows concomitant low FVC and obstruction. One, however, might argue that Glady’s formula is preferable because it is much simpler than ours. If the calculation of the formula required a reader to calculate by hand while interpreting PFTs, one could see the lack of appeal. However, the values of our formula could easily be added to PFT softwares so that it would appear “automatically” on a spiromtry for a physician to interpret.
A prior study by Lefante et al. attempted to derive an equation to account for the effects of airflow obstruction on the observed FVC. They found that in patients with an FEV1/FVC ratio <0.70, obstruction explained 15 to 17% of the variability in FVC percent predicted [14]. However, the formula used in a later study showed that such adjustment produced a 9% false negative rate [2]. With our formula, no such adjustment is warranted.
A limitation to our study could be that the decision to undergo for spirometry or a complete PFT, including TLC measurement, was not controlled. It could have been made by the referring physician possibly due to a higher clinical suspicion of restriction. This could raise the suspicion for ascertainment bias in this case. Actually a recent study looked into this dilemma and compared patients referred for spirometry alone and those referred for both spirometry and lung volume measurement [8]. They found the same frequency of a restrictive spirometric pattern in both groups, suggesting no significant ascertainment bias by the clinical selection of the physician for the test.
CONCLUSION
Spirometry is a helpful tool that can be used to exclude the presence of restriction even in the presence of obstruction, limiting the expense of further testing while retaining sensitivity. The previously proposed tools to exclude restriction may not be that sensitive when utilized in patients with concomitant low FVC and obstruction. Our formula performs superior to the previously described algorithms.
CONFLICT OF INTEREST
None.
ACKNOWLEDGEMENT
Study performed at Henry Ford Hospital, Detroit, Michigan, USA.
FUNDING/DISCLOSURE
The study was not funded by any source. There is no conflict of interest or disclosure by any of the authors related to the study. The material is original, is not currently under consideration nor has been accepted for publication or published elsewhere and that all authors have read the manuscript and approve its submission.