All published articles of this journal are available on ScienceDirect.

Computed Tomography-Based Centrilobular Emphysema Subtypes Relate with Pulmonary Function
Authors Info & Affiliations
Abstract
Introduction:
Centrilobular emphysema (CLE) is recognized as low attenuation areas (LAA) with centrilobular pattern on high-resolution computed tomography (CT). However, several shapes of LAA are observed. Our preliminary study showed three types of LAA in CLE by CT-pathologic correlations. This study was performed to investigate whether the morphological features of LAA affect pulmonary functions.
Materials and Methods:
A total of 73 Japanese patients with stable CLE (63 males, 10 females) were evaluated visually by CT and classified into three subtypes based on the morphology of LAA including shape and sharpness of border; patients with CLE who shows round or oval LAA with well-defined border (Subtype A), polygonal or irregular-shaped LAA with ill-defined border (Subtype B), and irregular-shaped LAA with ill-defined border coalesced with each other (Subtype C). CT score, pulmonary function test and smoking index were compared among three subtypes.
Results:
Twenty (27%), 45 (62%) and 8 cases (11%) of the patients were grouped into Subtype A, Subtype B and Subtype C, respectively. In CT score and smoking index, both Subtype B and Subtype C were significantly higher than Subtype A. In FEV1%, Subtype C was significantly lower than both Subtype A and Subtype B. In diffusing capacity of lung for carbon monoxide, Subtype B was significantly lower than Subtype A.
Conclusion:
The morphological differences of LAA may relate with an airflow limitation and alveolar diffusing capacity. To assess morphological features of LAA may be helpful for the expectation of respiratory function.
INTRODUCTION
COPD is a highly prevalent disorder characterized by incompletely reversible airflow limitation. Emphysema is a major pathological change of COPD that is characterized by an abnormal and permanent enlargement of distal air spaces and alveolar wall destruction. It is estimated that these pathological changes caused by an inflammatory response of the lung to noxious particles and gases [1].
Several investigators reported emphysema phenotypes or subtypes [2-5]. Sverzellati et al. [2] reported females exhibited an emphysema phenotype less extensive in each pulmonary lobule characterized by smaller emphysematous areas and less concentrated in the core of the lung, compared with males. Saitoh et al. [3] reported pulmonary function was significantly different when emphysema developed predominantly in the upper or lower lobes. Adir et al. [4] reported a phenotype with severe precapillary pulmonary hypertension in patients presenting with normal spirometry and severely reduced diffusion capacity. In addition, the severity of emphysema varies widely despite the same disease stage of COPD [5]. Therefore, emphysema is a heterogenous disorder that arises from lung tissue destruction and small airway disease in varying combinations and severity within an individual.
Centrilobular emphysema (CLE) is usually associated with destruction of alveolar walls in the central portion of acinus, it is more often found in upper lung zones and is commonly associated with cigarette smoking [6]. Low attenuation areas (LAA) were reportedly detected by high-resolution computed tomography (CT), which allows for early detection of emphysema [7]. LAA located in centrilobular area is a radiological manifestation of CLE lesions, and several types of LAA are observed. There are supposed to be morphological features of LAA in each patient with CLE.
Our preliminary study using CT-pathologic correlations showed LAA shape indicated the destructed or dilated sites in secondary lobules in early stage of CLE [8]. According to our observation of LAA within 10 mm in diameter, LAA with round or oval shape with well-defined border, LAA with polygonal or irregular shape with ill-defined border, and LAA with irregular shape with ill-defined border coalesced with each other related to dilatation of bronchioles, destruction of proximal part of alveolar ducts, and destruction of distal part of alveolar ducts, respectively. However, the relationships between LAA shapes and pulmonary function and between LAA shapes and cigarette smoking remain unknown.
The aim of this study was to investigate whether morphological features of LAA affect pulmonary function in CLE. Therefore, we classified patients with CLE into three subtypes according to the morphological features of LAA and compared them with their pulmonary function tests (PFT) and smoking index.
MATERIALS AND METHODS
Patients
All patients were Japanese and recruited from Sapporo Medical University Hospital. The radiological findings and the clinical information were evaluated retrospectively. The patients who were examined by both CT and PFT in a month were selected. Between August 2005 and December 2009, 73 patients (63 males, 10 females) with an average age of 70.3 ± 8.9 years (aged 45 to 92 years) were selected from our medical records. Their average smoking index was 53.0 ± 25.1 pack-years (mean ± SD). All patients were current or former smokers.
The level of serum alpha-1 antitripsin was not measured because its deficiency is very rare in Japan. We excluded the patients with infectious diseases, allergic diseases, collagen diseases, granulomatous diseases and neoplastic diseases. In addition, we excluded the patients who received lung operation. Also we excluded the patients with CLE with severe bullous changes and/or with severe emphysematous changes, because it was difficult to determine CLE subtype in relation with secondary lobules and they were not fully able to undergo pulmonary function tests.
Informed written consent was obtained from all patients. This study was approved by the Institutional Review Board of Sapporo Medical University.
CT
Chest CT scans were obtained on a Light Speed Ultra scanner (GE, USA) using 1.25 mm collimation at 5 mm intervals from the sternal notch to below the diaphragm during breath-holding after deep inspiration in a supine position at 140 kVp, 170 mA. The lungs were imaged at the window width of 1000 HU and the window level of -700 HU.
CLE Subtypes
The patients were classified into three CLE subtypes based on the CT findings as follows:
Subtype A; CLE which showed round or oval LAA with well-defined border, individually surrounded by normal lung density
Subtype B; CLE which showed polygonal or irregular-shaped LAA with ill-defined border, individually surrounded by normal lung density
Subtype C; CLE which showed irregular-shaped LAA with ill-defined border, coalesced with each other
When we recognized the characteristic LAA as more than 50% of all LAA by visual assessment, we determined it as dominant LAA. Representative CT images of three subtypes were shown in Fig. (1). Because Subtype C is similar to panlobular emphysema, we determined it as Subtype C when patients with emphysema had partly LAA with ill-defined border with centrilobular distribution.
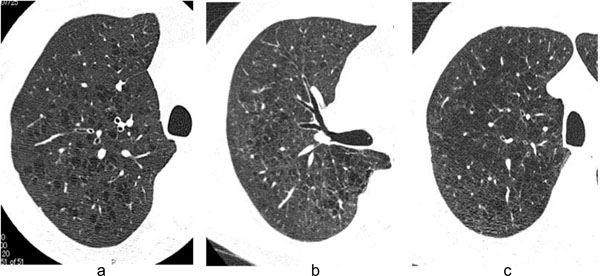
HRCT images of three subtypes. Typical high-resolution CT images in Subtype A (a), Subtype B (b), and Subtype C (c) are shown. Subtype A is defined as emphysema which showed round or oval shape LAA with well-defined border. Subtype B is defined as emphysema which showed polygonal or irregular-shaped LAA with ill-defined border. Subtype C is defined as emphysema which showed irregular-shaped LAA with ill-defined border coalesced with each other.

Smoking indexes of three subtypes. In smoking index, the median of Subtype B and Subtype C were significantly higher than that of Subtype A group. The data was expressed as median with first quartile point (25 percentile) and third quartile point (75 percentile).
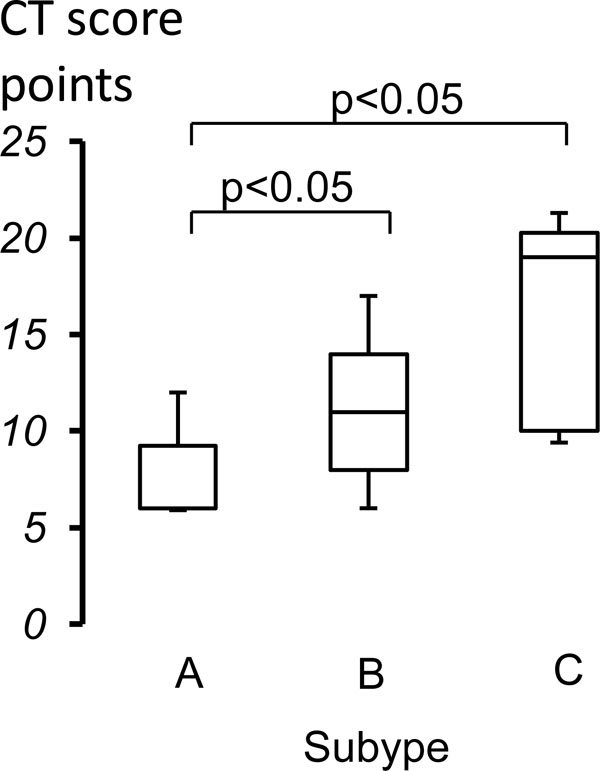
Comparison of CT scores of three subtypes. In CT score, the median of Subtype B and Subtype C were significantly higher than that of Subtype A group. The data was expressed as median with first quartile point (25 percentile) and third quartile point (75 percentile).
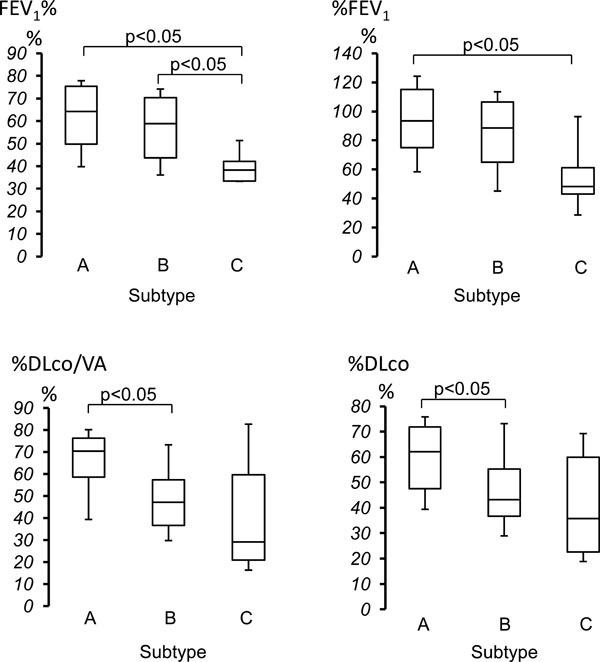
Comparison of pulmonary function of three subtypes. In FEV1%, the median of Subtype C was significantly lower than those of Subtype A and Subtype B group. In %FEV1, the median of Subtype C was significantly lower than that of Subtype A group. In %DLco/VA and %DLco, the median of Subtype B was significantly lower than that of Subtype A group. The data was expressed as median with first quartile point (25 percentile) and third quartile point (75 percentile).
CT Score
We evaluated the extent of CLE by visual scoring in bilateral lung fields according to the method of Goddard [9]. In brief, both lungs were divided into totally six areas consist of three lung fields; aortic arch, carina and inferior pulmonary vein levels. The extent was estimated using a five-point scale for each lesion. Total scores were calculated (maximum total: 24 points) and the severity of emphysema was graded as follows; 0 point (no emphysematous lesions), 1 point (LAA < 25% of the entire lung field), 2 points (25% ≦ LAA < 50% of the entire lung field), 3 points (50% ≦ LAA < 75% of the entire lung field), and 4 points (75% ≦ LAA of the entire lung field).
Visual Assessment for CLE Subtypes
Determination of CLE subtypes and scoring of its distribution were performed with no knowledge of patients’ information and independently by two chest physicians who are expert for chest image diagnosis (M.T and G.Y.). The method of recognition of morphological features of LAA was a subjective one based on visual judgment. When there was a conflict in evaluation, they discussed the problem together to reach a consensus.
PFT
Chestac 9800 (Chest Co, Tokyo, Japan) was used for PFT. We used parameters as follows; predicted percentage of vital capacity (%VC), forced vital capacity (FVC), forced expiratory volume in one second to forced vital capacity ratio (FEV1%), predicted percentage of forced expiratory volume in one second (%FEV1), residual volume to total lung capacity ratio (RV/TLC%), 50% of maximum mid expired flow rate of forced vital capacity () and 25% () and maximum mid expiratory flow (MMF). We measured predicted percentage of diffusion capacity (%DLco) and predicted percentage of diffusion capacity divided by the alveolar volume (%DLco/VA) according to single-breath carbon monoxide uptake.
Statistical Analysis
The results of CT scores and PFT were expressed as median with first quartile point (25 percentile) and third quartile point (75 percentile). The differences between the three groups were assessed by using the Kruskal Wallis H-test. When the differences were considered statistically significant, subsequently Mann-Whitney U-test with Bonferroni correction was performed for post hoc test. The differences were considered statistically significant when the p value was less than 0.05.
RESULTS
Frequency of CLE Subtypes
A total of 73 CLE patients were classified into three groups according to the CT findings (Table 1). Twenty (27%), 45 (62%) and 8 cases (11%) of patients were grouped into Subtype A, Subtype B and Subtype C groups, respectively. Subtype B group was the most superior in patient number. In addition, there was no significant difference in age among three groups. Concordance rate between the two reviewers of CT about determination of CLE subtypes was 76.7 %.
CT Score, Smoking Index and Pulmonary Function Test in Three CLE Subtypes
| Subtype (n) | A (20) | B (45) | C (8) | p Value |
|---|---|---|---|---|
| Male/Female | 15/5 | 40/5 | 8/0 | |
| Smoking index (pack-years) | 33.8 (17.5-50.0) | 55.0 (41.1-75.0) | 49.4 (44.0-73.3) | <0.05 |
| age (y/o) | 74.0 (68.5-82) | 72.0 (63.5-75.3) | 68.5 (63.0-71.5) | NS |
| CT score (points) | 6.0 (6-9.5) | 11.0 (7.8-14.0) | 19.0(10.0-20.5) | <0.05 |
| %VC (%) | 117.9(101.2-124.7) | 114.8 (103.6-123.9) | 98.25 (81.5-120.8) | NS |
| FEV1% (%) | 64.2 (49.5-75.7) | 58.9 (43.7-70.5) | 38.3 (33.4-43.0) | <0.05 |
| %FEV1 (%) | 93.4 (72.2-115.6) | 88.5 (64.5-106.9) | 48.3 (38.3-71.3) | <0.05 |
| FVC (L) | 3.1 (2.7-3.8) | 3.5 (3.0-4.0) | 3.2 (2.5-3.5) | NS |
| RV/TLC (%) | 35.8 (30.0-44.5) | 37.4 (32.7-45.3) | 43.3 (37.6-57.7) | NS |
| (L/sec) | 1.1 (0.6-2.2) | 1.1 (0.4-1.9) | 0.4 (0.3-0.7) | NS |
| (L/sec) | 1.2 (0.6-2.3) | 0.3 (0.1-0.5) | 0.2 (0.1-0.3) | NS |
| MMF (L) | 0.8 (0.4-1.7) | 0.8 (0.3-1.4) | 0.3 (0.3-0.6) | NS |
| %DLco/VA (%) | 70.4 (56.7-76.3) | 47.2 (36.7-58.1) | 29.0 (19.0-67.4) | <0.05 |
| %DLco (%) | 62 (46.0-72.3) | 43.3 (36.2-55.4) | 35.7 (21.3-60.7) | <0.05 |
There were significant differences in CT score, smoking index and pulmonary function test including FEV1%, %FEV1, %DLco/VA and %DLco. The data was expressed as median with first quartile point (25 percentile) and third quartile point (75 percentile).
Smoking Index
Smoking index was compared among three subtype groups and there were significant differences among them (Table 1). Smoking index of both Subtype B and Subtype C were significantly higher than that of Subtype A groups (Fig. 2). In addition, there was no significant difference between Subtype B and Subtype C groups.
CT Score
CT scores were compared among three subtype groups and there were significant differences among them (Table 1). CT scores of both Subtype B and Subtype C were significantly higher than that of Subtype A groups (Fig. 3). In addition, there was no significant difference between Subtype B and Subtype C groups.
Pulmonary Function Findings
PFT values were compared among three groups and there were significant differences in FEV1%, %FEV1, %DLco/VA and %DLco among them (Table 1).
FEV1% was significantly lower in Subtype C as compared to both Subtype A and Subtype B groups. There was no significant difference between Subtype A and Subtype B groups. %FEV1 was significantly lower in Subtype C as compared to Subtype A groups. There was no significant difference between Subtype A and Subtype B, and between Subtype B and Subtype C groups (Fig. 4). Both %DLco/VA and %DLco were significantly lower in Subtype B as compared to Subtype A groups. There was no significant difference between Subtype A and Subtype C, and between Subtype B and Subtype C groups (Fig. 4). In addition, there was no significant difference in %VC, FVC, RV/TLC%, , and MMF among three subtypes.
DISCUSSION
LAA is the characteristic findings in CLE, which relate with emphysematous lesions and occur from the center of the secondary lobule. According to CT-pathologic correlation studies [6, 8, 10], LAA is consistent with the affected sites in the secondary lobule, which influence on airflow limitation and diffusion capacity. In this study, we focused on three subtypes determined by morphological features of LAA on CT, and examined their pulmonary function and the influences of cigarette smoking.
There were characteristic differences among three subtypes. Subtype A showed lower CT scores and higher values including FEV1%, %FEV1, %DLco/VA and %DLco in PFT. Because pulmonary function was not so impaired in Subtype A, destruction and/or dilatation of alveolar structures were supposed to be mild. Subtype B was the most frequent among three groups and showed approximately intermediate values between Subtype A and Subtype C in PFT. Destruction and/or dilatation of alveolar structures were supposed to be moderate in Subtype B. Subtype C showed higher CT scores and lower values including FEV1% and %FEV1. Because airflow limitation was evident in Subtype C, destruction and/or dilatation of alveolar structures were supposed to extend to the entire secondary lobule in Subtype C. However, Subtype C did not show a significant difference in diffusion capacity in spite of the higher CT scores. We thought Subtype C did not show significant reduced diffusion capacity because of relatively large variation in values of both %DLco/VA and %DLco. A small number of patients with Subtype C might also influence on the results. According to our results, we concluded that LAA with ill-defined border might be a sign showing airflow limitation and reduced diffusion capacity.
We speculate that deposition sites of the particles or gases from cigarette smoking relate with morphological features of LAA on CT. Cigarette smoke has approximately 109 to 1010 particles /ml, and particles range in size from 0.1 to 1.0μm with a mean of 0.2μm [11]. Gases generated by cigarette smoking include highly levels of carbon monoxide and hydrogen cyanide, those interfere oxygen transport and metabolism [12]. The long term cigarette smoking is toxic to airway epithelial cells and leads to destruction of pulmonary parenchyma. Very small particles or gases will deposit in alveolar wall and cause inflammation there, leading to Subtype B or Subtype C. Similarly, small particles deposited in terminal bronchioles will cause destruction and/or dilatation of bronchioles, leading to Subtype A.
CT scores and smoking index in both Subtype B and Subtype C were higher than Subtype A. Therefore, both Subtype B and Subtype C were visually progressive and more affected by cigarette smoking as compared to Subtype A. Subtype B and Subtype C have similar properties of peripheral border of LAA. It is likely to progress from Subtype B to Subtype C. Mishima et al. [13] reported that the neighboring smaller LAA clusters tend to coalesce and form larger clusters as the weak elastic fibers separating them break under tension. This process leaves the percentage of the lung field occupied by LAA unchanged and increases the number of large clusters. It may be possible that Subtype B progresses to Subtype C. On the other hand, Subtype A is morphologically different from Subtype B or Subtype C. Susceptibility to smoking particles may exist among these subtypes. Even ex-smokers with emphysema had reportedly showed evidence of persistent airway inflammation and progression of emphysema [14]. Progression or extension of CLE lesions is thought to be very slow. Long term study will be necessary to elucidate progress of three subtypes.
There are limitations in this study. First, pathological confirmation was not performed. Affected sites of each subtype depend on our speculation based on CT and PFT findings. Comparison between pathological findings and LAA may be required. Second, our results came from only qualitative visual inspection. Extensive research may be need using a quantitative CT-based metrics to define structural abnormality of CLE [15]. Third, we could not exclude the contribution of small airway disease to airflow limitation in PFT studies. CLE is considered to be a chronic inflammatory process, which is not only lung parenchymal disease but also airway disease. Fourth, the relationship with each subtype and response to the treatment has not been studied. Since there were differences between each subtype by PFT, differences may exist in the effect of the drug such as long acting β2 agonists or anti-cholinergic agents. In the future, it is necessary to examine the effect of treatment with each subtype.
Our subjective visual assessment for CLE is easy to perform. CLE subtypes described in the present study may be useful for predicting PFT in patients with CLE.
CONFLICT OF INTEREST
The authors confirm that this article content has no conflict of interest.
ACKNOWLEDGEMENTS
All authors thank Dr. Masahiko Yamagishi (Department of Internal Medicine, Sapporo Kojin-kai Hospital) for his useful suggestions.