All published articles of this journal are available on ScienceDirect.

Identification and Measurement of Carbonic Anhydrase-II Molecule Numbers in the Rat Carotid Body
Authors Info & Affiliations
Abstract
Carbonic anhydrase (CA) in the carotid body (CB) plays an important role in the maintenance of blood PO2 and PCO2/pH homeostasis by regulating ventilation. It has been observed that the activity of CA in the rabbit CB is stronger under hypoxic conditions than under normoxic and hyperoxic conditions. In conditions of chronic hypoxia, the volume of the CB increases significantly because the number of type I and II cells increases. So far, the number of CA molecules in the CB has not been assessed. We develop a technique to quantify the number of CA molecules in the CB. The CBs were dissected out from 8 rats, immediately frozen with liquid nitrogen, pulverized and centrifuged. The proteins extracted from CB tissue were heat-denatured and separated by electrophoresis on a 12.5% denatured-polyacrylamide gel (SDSPAGE); a 31 kDa protein band was determined which reacted with a rabbit polyclonal antibody specific for rat CA-II in Western blot analysis. The immunoreactive 31 kDa CA-II protein was detected and quantified by laser scanner densitometry using 125I-rProtein A as a tracer. The mean 125I radioactivity emitted by the antibody bound CA-II was 31277 cpm. This value corresponds to 4.57 ng CA-II. When compared with a rat CA-II calibration curve, an average of number of 3.54 x 10⁷ CA-II molecules were quantified for 1 µg of whole CB tissue. This is a sensitive and accurate radioimmunoassay technique and may be useful in future studies on the role of CA-II in different pathophysiologic conditions.
INTRODUCTION
The carotid body (CB), alternatively called “carotid glomus”, is a small cluster of chemoreceptors and supporting cells located near the bifurcation of the carotid artery. The main function of the CB is to maintain homeostasis of blood oxygen partial pressure (PO2), carbon dioxide partial pressure (PaCO2), and acid-base balance by regulating ventilation. The chemoreceptors in the CB are innervated by a branch of the glossopharyngeal nerve, which projects to the respiratory center in the brainstem. A decrease in arterial PaO2 or an increase in PaCO2 and acidity, when detected by the chemoreceptors, stimulates the CB nerve and activates a respiratory reflex, which leads to an increase in ventilation so as to restore normal blood PO2 and PCO2/pH. The rapid response of the CB to changes in PaCO2/pH depends on the function of carbonic anhydrase (CA), an enzyme found in many mammalian cells and tissues, including the CB [1,2]. CA catalyzes the hydration of CO2 to facilitate the rapid restoration of normal intracellular pH in response to the changes in extracellular PaCO2. This chemical stimulus is coupled with a release of neurotransmitters from the CB that generates action potentials in the central nervous system’s afferent nerve terminal.
CA was first identified in the CB by Lee and Mattenheimer in 1964 [3], and at least 14 distinct CA isozymes have been identified currently [4]. According to their cellular localizations, these isozymes have been characterized into four broad aubgroups, which, in turn consist of several isoforms: the cytosolic CAs (CA-I, CA-II, CA-III, CA-VII and CA XIII), mitochondrial CAs (CA-VA and CA-VB), secreted CAs (CA-VI) and membrane-associated CAs (CA-IV, CA-IX, CA-XII, CA-XIV and CA-XV) [5]. CA-II is found in the cytosol of cells in numerous organs. In the CB, CA-II is found in glomus or type I cells, as well as in the nerve bundles. It may also exist in vascular smooth muscle cells [6]. In the CB, the catalytic activity of CA-II isozyme is stronger than that of the other two isozymes expressed at this anatomical site, CA-I and CA-III. In the rabbit, it has been observed that the whole CA activity in the CB is stronger under hypoxic condition than under normoxic and hyperoxic conditions [7].. However, it is still unknown whether the hypoxia-related increase in CA activity is due to increase in the specific activity of CA molecule or increase in the number of CA molecules, or both mechanisms. It would help us to better understand the role of CA in the maintenance of homeostasis if the number of CA molecules could be sensitively and accurately quantified.
This leads us to develop a new technique to quantitatively measure the numbers of CA molecules in the CB by using Western blot (WB), SDS-PAGE electrophoresis and indirect radioimmunoassay techniques.
METHODS
Tissue Collection
The proposed study was approved by Chieti University’s Ethical Committee for the Use of Animals and was conducted in accordance with the guidelines established by the US National Institutes of Health. Eight pathogen-free female Wistar rats (Charles River Laboratories, Inc. Wilmington, MA) weighing between 250-300 gram were used. All rats were anesthetized by intraperitoneal injection of 40 mg/kg pentobarbital sodium. A longitudinal incision was made in the middle cervical skin, and the regions of the carotid bifurcation were surgically exposed. Then, a left thoracotomy was made to expose the heart. A modified Tyrode’s solution (N-2-hydroxyethylpiperazine-N'-2-ethanesulfonic acid/NaOH, pH 7.4) equilibrated at a given PO2 of 20 Torr at 37°C) was perfused through the heart, maintaining the temperature at 35.5 +/- 0.5 °C, until the efferent perfusate was blood-free [1]. Then, CBs were quickly dissected out and placed on a Petri dish with ice cold Tyrode’s solution to remove the surrounding fat and connective tissue under a binocular microscope. Residual blood cells were carefully removed by osmotic shock and washing with MilliQ H2O. Finally, the CBs were frozen with liquid nitrogen, until further process for CA-II assay.
Preparation and Determinations of Protein Extract
Frozen CB samples were pulverized using a micro-pestle of borosilicate glass, while kept in liquid nitrogen, and homogenized in ice-cold Laemmli buffer (2% sodium dodecyl sulphate, 10% glycerol, 5% 2-mercaptoethanol, 62.5 mM Tris HCl, pH 6.8) [8] mixed with protease inhibitor cocktail at 1:100 (P8340 Sigma-Aldrich). CB weights were obtained by subtracting the weight of the homogenization buffer from the weight of the each CB homogenate. Then, the tissue homogenates were incubated at 4°C for 1 hour with gentle agitation and centrifuged at 12000 rpm for 20 minutes, at 4°C. The protein concentration in the supernatant was determined using a BCA protein assay kit (Pierce Chemical, Rockford, IL), according to the enhanced protocol (linear range of detection of 5-250 µg/ml of protein).
Antiserum
Rabbit antiserum to purified (SDS-denatured) rat CA-II isozyme was generously provided by Dr S.J. Dodgson (Department of Physiology, School of Medicine, University of Pennsylvania). Preparation of the immunogen, immunization regimen, serum preparation and characterization according to description of Dodgson and his colleagues [9, 10]. For Western blot analysis, the rabbit polyclonal anti-CA II antibody reacted specifically with the rat and bovine isozyme CA-II [8]. Determination of standard curves and radioimmunoassay to assess maximum binding of CA-II in the presence of antibody excess were performed as described by Jeffery et al. [9].
Purified Rat CA-II
Purified rat CA-II was kindly provided by Dr. Dodgson. Briefly, the rat CA-II isozyme was purified from rat hemolysate by affinity chromatography on sulfonamide columns [11] (ProntoSIL).
Amino acid analysis of the putative CA-II was performed by trypsin digestion and amino acid terminal sequence according to Linder et al. [12]. The CO2 hydration activity of the 31 kDa protein from rat hemolysate was determined using a potentiometric assay as described by Wistrand and Wahlstrand [13].
Electrophoretic Separation of CB Protein Extract and Identification of CA-II
Equal amounts of lysates containing 250 μg of CB cytoplasmic proteins extract (in 30 μl) were added with 5x running buffer (final concentration: 50 mM Tris-hydrochloride pH 6.8, 10 mM dithiothreitol, 2% SDS, 10% glycerol, 0.001% bromophenol blue) heat-denatured (at 95°C for 5 min) and electrophoresed trough a 12.5% SDS-polyacryl-amide gel.
For determination of the relative motilities (relative molecular weight [Mr]), marker polypeptides were also electrophoresed with protein samples, in a non contiguous lane to avoid contaminations, and blotted to nitrocellulose, namely: rabbit muscle phosphorylase b (97.4 kDa), bovine serum albumin (66.2 kDa), hen egg-white albumin (45 kDa), bovine carbonic anhydrase (31 kDa), soybean trypsin inhibitor (21.5 kDa), and hen egg white lysozyme (14.4 kDa) (Bio-Rad Laboratories, Richmond, CA). Densitometer tracings of the unstained polyacrylamide gel at 280 nm were obtained by a Photovolt Densitometer Model 520 A (Photovolt Corporation, New York, NY). The absolute integrated optical density of each band was analyzed by GelPro analyzer software (MediaCybernetics, Silver Spring, MD), which allowed to calculate the molecular weight of the unknown bands in the CB samples.
Electroblotting and Indirect Radioimmunoassay of CA-II
Following the electrophoresis, rat CB protein (from 250 µg tissue) was transferred from the gels on to Protran nitrocellulose membrane (0.1 μm, Scheiler & Schuell, Dassel, Germany, Cat. No. 401180) by electroelution using a Transblot apparatus (Bio-Rad Laboratories, Hercules, CA) at 100 mA (30V) overnight, at 4°C. For transfer, the gel was soaked in the blotting buffer (Tris/glycine, pH 7.4, containing 20% (v/v) methanol) and placed in a sandwich made up of filter paper soaked in 0.5% SDS, the gel, nitrocellulose membrane and filter paper soaked in the blotting buffer. The efficiency of electrotransfer of proteins was checked by staining the gels after transfer with Coomassie brilliant blue R-250 (ICN Biomedicals, Aurora, OH) and analyzing the gel by densitometry.
The nitrocellulose sheet was washed and first incubated overnight at 4°C with blocking buffer (3% bovine serum albumin Fraction V in NTE-NP40 (150 mM NaCl, 50 mM Tris-HCl, pH 7.5, 2 mM EDTA, 0.1% Nonidet-P40; all chemicals from Sigma, St. Louis, MO); then the membranes were sealed in plastic bag containing a 1:100 dilution of rabbit anti-rat CA-II antiserum [8], for 3 h at room temperature, on a rocking platform. Thereafter, the membrane was washed three times with NTE-NP40 for 10 min and then incubated in 2 ml of blocking buffer containing 20µl 125I-rProtein A (2 x 10⁵ cpm; 50 ng; NEX-146 stock 107 cpm/μg; Perkin Elmer, Waltham, MA) for 1 h at room temperature. Protein A reacts with most common IgG subclasses and is therefore suitable for direct autoradiographic detection of membrane-bound antibody in western blotting applications with low background binding and signal. After 1.5 h incubation, the unbound 125I-rProtein A was removed by washing with NTE-NP40 three times at 37°C for 2 h.
The membranes were exposed for 3 days to a high-density phosphor imaging screen (Bio-Rad Laboratories), which captures latent images produced by the γ emissions of the 125I radioisotope. Upon laser-induced stimulation, light was emitted from the storage phosphor screen in proportion to the amount of radioactivity in the sample. Wide linear dynamic range (5 orders of magnitude) enables quantitation and visualization of both weak and strong signals in a single exposure. After digitalization of the results, the screen was exposed to extra-bright light of ImageEraser light box and reused. A laser scanning densitometer (GS-250 Molecular Imager System; Bio-Rad Laboratories, Hercules, CA) was used to convert the radioactive signals emitted by the immunoreactive areas on the phosphor screen into digital images for subsequent densitometric analysis by the software package Phosphor Analyst (Bio-Rad Laboratories, Hercules, CA) [14]. The radioactive signal emitted by unloaded parallel lanes in the same gel was considered as background. CA-II quantitation was performed 4 independent experiments.
Calibration Curve for CA-II Assay
Aliquots of purified rat CA-II (kindly provided by Dr Dodgson, University of Pennsylvania) were used to define a calibration curve for rat CB CA-II. Escalating known concentrations of purified CA-II isozyme (0.625, 1.25, 2.5, 5, and 10 ng) were eletrophoresed, blotted and detected (as described in the previous paragraph) using various combinations of concentrations of anti-CA-II antibody and calibration curves were drawn and detected with 1:100 anti-CA II antibody and 50 ng 125I-rProtein A (stock at 107 cpm/μg; NEX-146, Perkin Elmer, Waltham, MA, USA). Assay accuracy was evaluated from 3 replicas of the experiment.
RESULTS
The weight of each CB ranged from 50 to 80 μg (mean = 63 µg, S.D.= 10), for a total CB weight of 1015 μg as shown in Table 1.
| Normal Wistar Rat | Carotid Body Weights Weight |
|---|---|
| CB No. | CB Weight (µg) |
| 1° | 58 |
| 1B | 61 |
| 2° | 72 |
| 2B | 76 |
| 3° | 50 |
| 3B | 54 |
| 4° | 74 |
| 4B | 61 |
| 5° | 80 |
| 5B | 71 |
| 6° | 51 |
| 6B | 55 |
| 7° | 53 |
| 7B | 59 |
| 8° | 68 |
| 8B | 72 |
| Total weight weight (µg) | 1015 |
| Mean | 63 |
| S.D. | 10 |
| Calibration Curve | |
|---|---|
| Purified CA-II (ng) | 125I Radioactivity (cpm) |
| 2.0 | 13639 |
| 3.5 | 24145 |
| 5.0 | 31277 |
| 6.5 | 41437 |
| 8.0 | 46916 |
| CB Sample (250 µg) | 125I (cpm) | CA-II | |
|---|---|---|---|
| 125I Counts (ng) | Calibration Curve (1) (ng) | ||
| 1 | 31017 | 4.5 | 4.9 |
| 2 | 31512 | 4.5 | 5.0 |
| 3 | 32133 | 4.6 | 5.1 |
| 4 | 32847 | 4.7 | 5.2 |
| Mean | 31877 | 4.6 | 5.1 |
| S.D. | 791 | 0.096 | 0.129 |
Accuracy: (5.1-4.6)/5.1=0.098.
(1) y = 5589.7x + 3534.
The proteins were extracted from 16 CB (in 8 rats) and analyzed by SDS-PAGE electrophoresis to verify the presence of the CA-II isozyme. Under denaturing conditions, the electrophoresis revealed a broad spectrum of protein bands according to the different molecular weights. As shown in Figs. (1, 2), a band at the position of 31 kDa molecular weight was revealed, which represents the CA-II isozyme, as evidenced by the standard control marker. This method enabled us to obtain quantitative data by measuring the radioactivity emitted by the complex formed by 125I-rProtein A+antibody+CA-II isozyme. Protein A binds to the Fc region of mammalian immunoglobulins, including rabbit IgG in a 1:1 molar ratio [15], in turn, IgG molecules owns two antigen binding sites. Therefore, the number of CA-II molecules bound to 125I-rProtein A could be calculated from the radioactivity detected by the imaging screen as shown in Fig. (2). By laser scanning densitometry we measured a mean of 31277 cpm emitted by the 31 KDa immunoreactive band, i.e. by 125I-rProtein A; such radioactivity value corresponds to 3.1 ng 125I-rProtein A. Making the assumption that the molar ratio of the complex 125I-rProteinA-Antibody-CAII is 1:1:2, and considering the corresponding apparent molecular weights, 4.6 ng CA-II was estimated ([3.1 ng/42000 Da]*31000 Da*2). Therefore, since 1 molecule mass equals 31 kDa, that is 5.15 x 10⁻¹¹ ng, the deduced number of CA-II molecules within the immunoreactive band is 4.6 ng /5.15 x 10-11 ng = 8.84 x 10¹⁰; that is, approximately 3.54 x 10⁷ molecules/μg CB tissue.

SDS-PAGE and Densitometry analysis of carbonic anhydrase II. The densitometric profile in upper figure shows the standard peak optical density and distance from the start point, which represents different molecular weight protein and corresponds to SDS-PAGE detected proteins. The standard CA-II protein is at the position 31.0 kDa band. Lower figure shows the peaks and distances of immunoreactive proteins extracted from carotid body obtained by SDS-PAGE. An immunoreactive protein peak showed at position 31 kDa confirms the presence of CA II in rat carotid body. Only the molecular weight region between 97.4 and 14.4 kDa is shown.
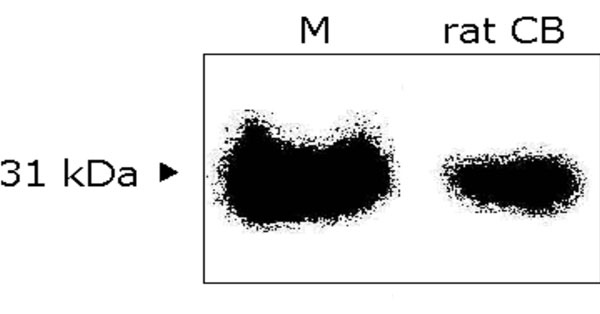
Western blot analysis of carbonic anhydrase II. The digital image of immunoreactive band from rat CB extract is at position of 31 kDa, which represents the CA-II, as evidenced by the standard bovine carbonic anhydrase-II marker. CB: carotid body; M: standard control marker.
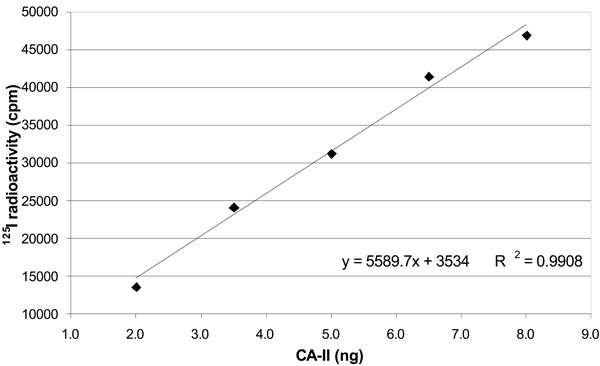
Correlation between 125I radioactivity and amount of standard carbonic anhydrase. The figure shows a positive linear relationship between 125I radioactivity reading (cpm) and carbonic anhydrase weight (µg). Data are represented as mean value of three independent curves.
In order to verify the accuracy of our radioimmunoassay for CA-II in the rat CB, we defined also a calibration curve for CA-II as shown in Table 2 and Fig. (3). A linear correlation between protein amounts and detected radioactivity was found in the range 0.625-10 ng CA-II (R2=0.9958).
A linear relationship between 125I radioactivity and the amount of standard CA-II was obtained using 1:100 dilution antibody dilution and 50 ng 125I-rProtein A (stock 107 cpm/μg; NEX-146, Perkin Elmer, Waltham, MA, USA). When control serum from non immune rabbit was used instead of the rabbit anti rat CA-II, no protein band was detected (data not shown).
As shown in Table 3, the weights of calculated CA-II according to calibration curve were very close to detected (observed) CA-II from the radioactivity data with an accuracy of 0.098.
DISCUSSION
The homeostasis of blood PO2 and PCO2/pH is well maintained via the control of ventilation under normal physiological conditions. Either the decrease in arterial PO2 or the increase in PCO2 and acidity stimulates the respiratory center of the brainstem resulting in an increase in ventilation and restoration of blood PO2 and PCO2/pH. The chemoreceptors located in the CB play an important role in rapid response to a change in blood PCO2 and PaCO2/pH mainly mediated by the CA activity.
CA is an enzyme of 31 kDa, whose active site contains a zinc atom. CA catalyzes the reversible hydration-dehydration of CO2-HCO3–. Since CA activity speeds up the reaction between CO2 and H2O with formation of H+ and HCO3–, this enzyme could be responsible for the sensitivity of the CB to CO2 by mediating the changes in extracellular pH. CB is highly sensitive to sudden changes in arterial blood PCO2, as well as positive or negative variations of pH [15-17]. The presence of CA in the CB has brought about several investigators to speculate its physiologic role in homeostasis of PO2, PCO2/pH [18-20]. CA activity in CB cells is essential for the speed of chemotransduction and amplitude of the initial response to CO2 and for its subsequent actions [12,14,17]. CA was first identified in the CB by Lee and Mattenheimer in 1964 [3], and, to date, at least 14 CA isozymes have been identified by various methods [8,9,16-18,21,22]. Yamamoto et al. [6] used immunoreactive assay and Western blot analysis to demonstrate the existence of CA isozymes I, II, and III in the rat CB. CA-II was mainly distributed in type I cells and nerve bundles. The results of the present study provide further evidence of CA-II in rat CB. Furthermore, the present study, at first time, provides the total number of CA-II molecules in rat CB.
Using a potentiometric method, Botré et al. identified at least two forms of CA in rabbit CB. One form of CA was found in the cytosol, and another was membrane-bound [16]. Later, Yamamoto et al. [19] identified CA isozymes I, II, and III. Porster et al. pointed out that CA-II activity is stronger than CA-I and CA-III [14]. Additionally, Foster et al. observed that CA-II mainly catalyses the CO2 and H2O reaction to produce H+ and HCO-3, which is critical to blood-gas CO2 exchange. CA-I and CA-III may play a supporting role in this process [23]. In the present study, in order to accurately identify and quantify CA in the CB of the rat, only CA-II was studied. We observed it with one-dimensional SDS PAGE electrophoresis and confirmed it with Western blot analysis using an anti-CA-II antibody and radio-labeled 125I. Additionally, we calculated the concentration of CA-II in CB tissue. Our study demonstrates that this technique provides a sensitive and accurate way to quantify the CA molecular numbers.
An early study showed that overall CA activity in rabbit CB was stronger under hypoxic conditions than under normal or hyperoxic conditions [6]. Under chronic hypoxia, the size of the CB increased significantly as a consequence of the increased number of type I and type II cells [23]. It is unclear whether the increased activity of CA or the increased volume of the CB during chronic hypoxia is due to increased efficiency of CA or to an increase in the number of CA-producing cells. The present study provides a useful technique that will enable us to measure CA concentrations directly and compare them among various conditions.
ACKNOWLEDGEMENTS
The authors wish to thank Dr. Danielle Masursky, Department of Anesthesiology, Upstate Medical University for her editorial assistance.